
Articles
A comprehensive guide on lighting
A comprehensive guide on lighting for all shooting enthusiasts who take their training and health seriously.
SCATT can’t guarantee sustainable work of our trainers if the lighting conditions are s...
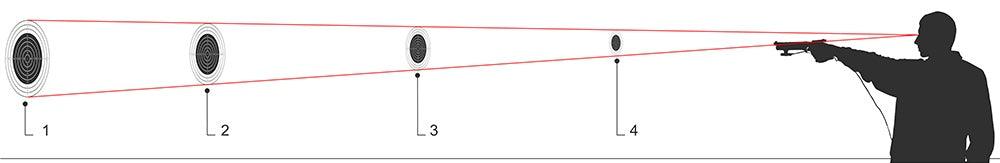
Dry practice at a reduced distance
For various reasons, each shooter has ever encountered the inability to train at a real distance to the target.Modern shooting simulators allow to simulate long distance shooting on the shorter dis...
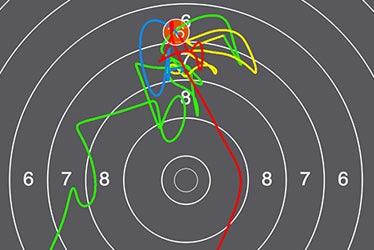
Errors in shooting and possible reasons for their occurrence
This article aims to interpret the basic error patterns seen in training with a SCATT system.
The data provided here relies on years of shooting experience, practical application of SCATT trainers...

Shooter's Coordination Analysis
The «Coordination Diagram» shows the time equal to one second to the actual time during which a shot is made along the X axis, and deflection from the centre of the target along the Y axis, while ...
Pulling the Trigger between the Heart Beats (Pulse Technique)
Every rifle shooter is aware of the constant movement of the arms during shooting. Arms movement determine its stability which may be subdivided into two components. The first component is contribu...